Trending Bilirubin
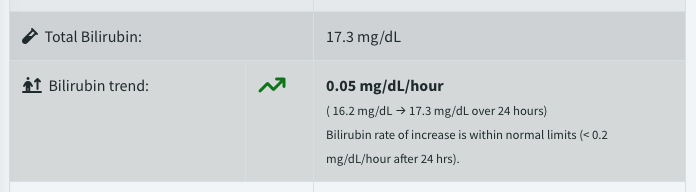
BiliTool can trend bilirubin over time with comma separated sequential results to reveal the rate of change (ROC), especially a rapid increase to help identify infants at risk of developing hyperbilirubinemia.
The 2022 AAP Guideline (see KAS 7) has established a rapid rate of increase as
≥ 0.3 mg/dL/hour (5.1 µmol/L/hour) in the first 24 hours or
≥ 0.2 mg/dL/hour (3.4 µmol/L/hour) after 24 hours.

Steps:
If more than one bilirubin result is available, enter the following in chronological order, separated by a comma:
- The prior age (in hours) at sample collection followed by the most recent age at collection..
- The prior bilirubin result, followed by the most recent bilirubin.
- The last age/bilirubin dataset evaluates the treatment thresholds, escalation of care, reflex testing, postdischarge recommendations, etc.
- The last two paired age/bilirubin datasets are used to establish the rate of change.
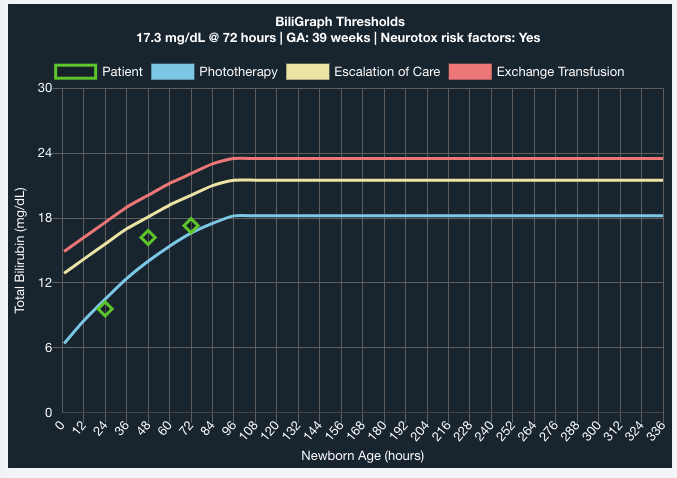
- Any number of datasets can be entered; all will be plotted on the graph at the bottom of the results screen. However, only the last two are evaluated for recommendations.
- On the results page, a trending arrow in the direction of change will change color from green to red if the ROC falls within the rapid rate of increase thresholds established by the AAP (see above). It may also include a brief recommendation (e.g. to perform a Direct Antiglobulin Test (DAT)).